2025-10-15
•

The journey of water from its source to your tap is an energy-intensive process, and with energy consumption comes a carbon footprint.1 While often overlooked, the environmental impact of piped water is a significant factor in urban sustainability. The typical carbon footprint of one litre of piped water varies considerably across different regions, influenced by a myriad of local factors. For India, a country with diverse geographical and infrastructural landscapes, this value can fluctuate significantly.
Globally, the carbon footprint of treating and distributing one cubic meter (1,000 litres) of piped water is estimated to be between 0.1 and 1.0 kilograms of carbon dioxide equivalent (CO2eq). This translates to a footprint of 0.1 to 1.0 grams of CO2eq per litre. However, this is a broad range, and the actual figure can be higher or lower depending on several key determinants.
The primary driver of the carbon footprint of piped water is the energy required for its abstraction, treatment, and distribution. The key factors influencing this energy consumption include:
While specific, city-wide data for the total energy consumption of water boards in India is not readily available, we can estimate the carbon footprint based on data for different stages of the water supply chain and the national electricity grid's emission factor. India's electricity grid has an average carbon emission factor of approximately 0.82 kilograms of CO2eq per kilowatt-hour (kg CO2eq/kWh). Using this, we can estimate the carbon footprint of piped water by considering the energy consumed in its journey.
Based on findings from the Centre for Science and Environment (CSE), the energy consumption for various stages of water supply in India is as follows:
This translates to an estimated carbon footprint of 0.40 to 0.90 grams of CO2eq per litre of piped water in India.
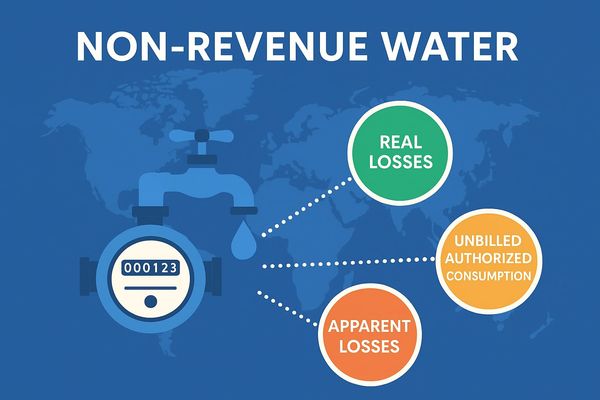
It is important to note that this is a generalized estimate. The actual carbon footprint can vary significantly between cities.7 For instance, a city like Delhi, which draws water from distant surface sources and also relies on groundwater, will have a different energy profile compared to a coastal city like Chennai, which is increasingly using desalination. Similarly, the efficiency of the water utility in managing its distribution network and minimizing non-revenue water (water lost to leaks) will have a substantial impact on the final carbon footprint.
The carbon footprint discussed above only accounts for the energy used to get the water to the tap. The energy consumed for heating water at the point of use, typically in households and commercial establishments, is often the largest component of the overall carbon footprint associated with water consumption.
Understanding the carbon footprint of piped water highlights the importance of water conservation. Every litre of water saved not only conserves a precious resource but also avoids the associated carbon emissions from its treatment and distribution. As Indian cities continue to grow and face increasing water stress, improving the energy efficiency of water infrastructure, and promoting water conservation will be crucial steps towards a more sustainable urban future.

2025-05-22

2025-09-24